DRAM price cycles and semiconductor stocks
Memory manufacturer stock prices have been going up-and-down recently. Right now the P/E ratios are down and some people are saying the equities are super cheap. My thinking is that things might be looking too good to be true, because the memory prices have gone through the roof. Maybe these prices are not sustainable. The AI boom is not going away, but my guess is that even small changes in the demand or customers willingness to pay may have big effect on the prices.
I wanted to understand how things have been in the past. This is of course just a rough look, since technology has changed. To get longer perspective we need to look conventional DRAM prices, while the hottest thing right now is the HBM (High Bandwidth Memory) To look into this, I made some charts with ChatGPT. The rest of this post is AI generated.
A gigabyte of DRAM cost the equivalent of about $6.5 million in 1980. By 2025, it cost about $4 in the historical price series used here. Along the way, prices repeatedly doubled or tripled in a year. I wanted to see how those swings looked once the long decline was stripped away, and whether they lined up with semiconductor stocks outperforming the S&P 500.
Long-term DRAM prices, 1980–2026
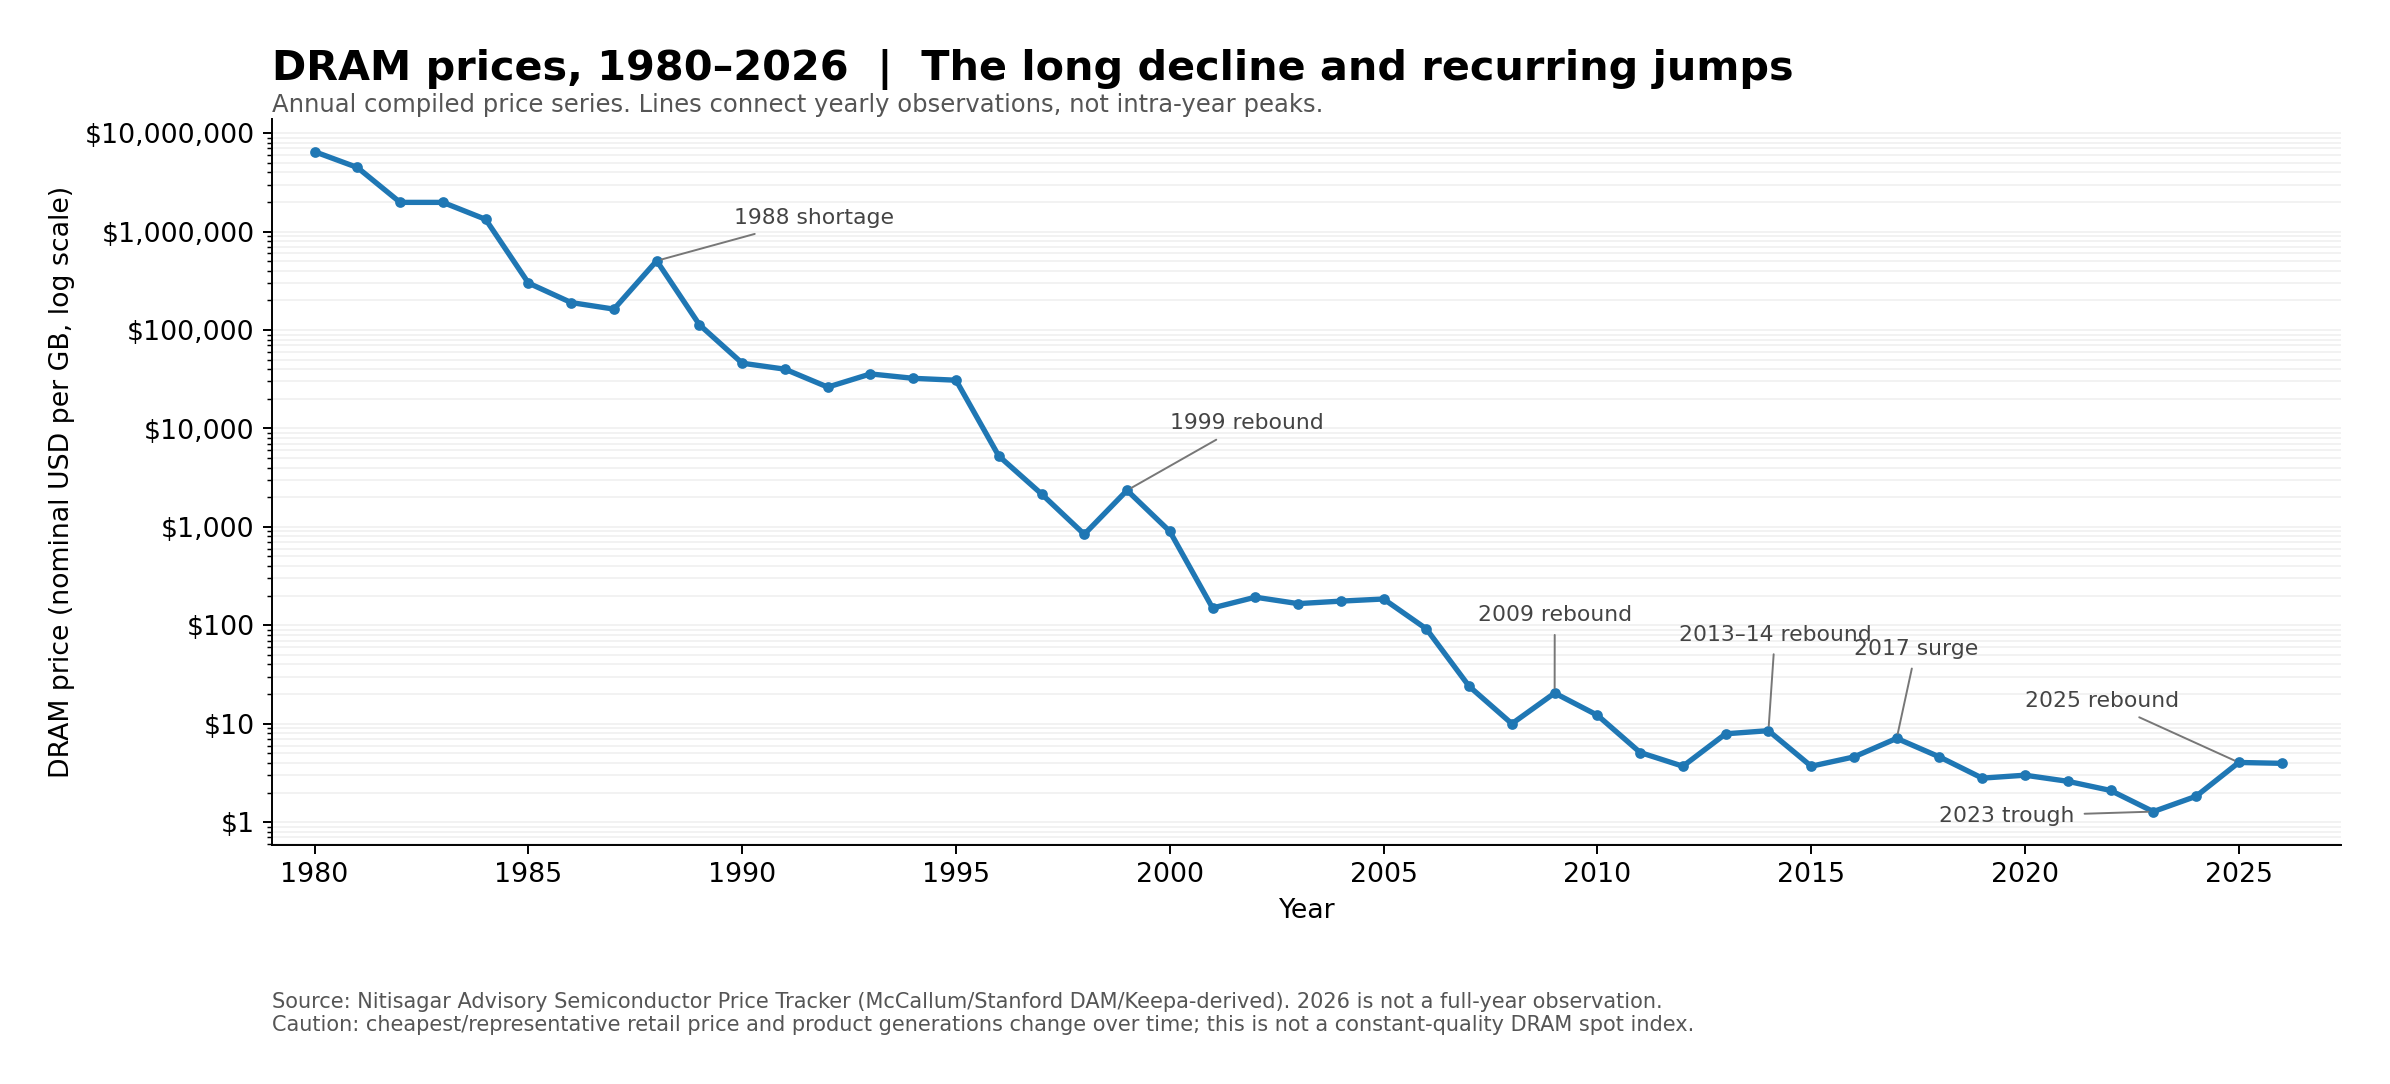
The chart shows the price of dynamic random-access memory (DRAM) in nominal dollars per gigabyte. Each step on the vertical axis is a tenfold change. In 1988, the price jumped from $163,000 to $505,000 per gigabyte in a year. In 2023, it reached $1.28, then climbed to $4.04 by 2025. Both episodes show up clearly on the log scale despite taking place at very different price levels. Nitisagar Advisory price series
The series draws on historical retail observations and more recent listings. Memory generations and collection methods change over time, and the 2026 observation covers only part of the year. It can also miss moves in specific markets. TrendForce reported rising server DRAM contract prices in November 2026 while spot-market momentum was limited. Stanford memory price methodology · TrendForce DRAM bulletin
DRAM price cycles, adjusted for the long-term trend
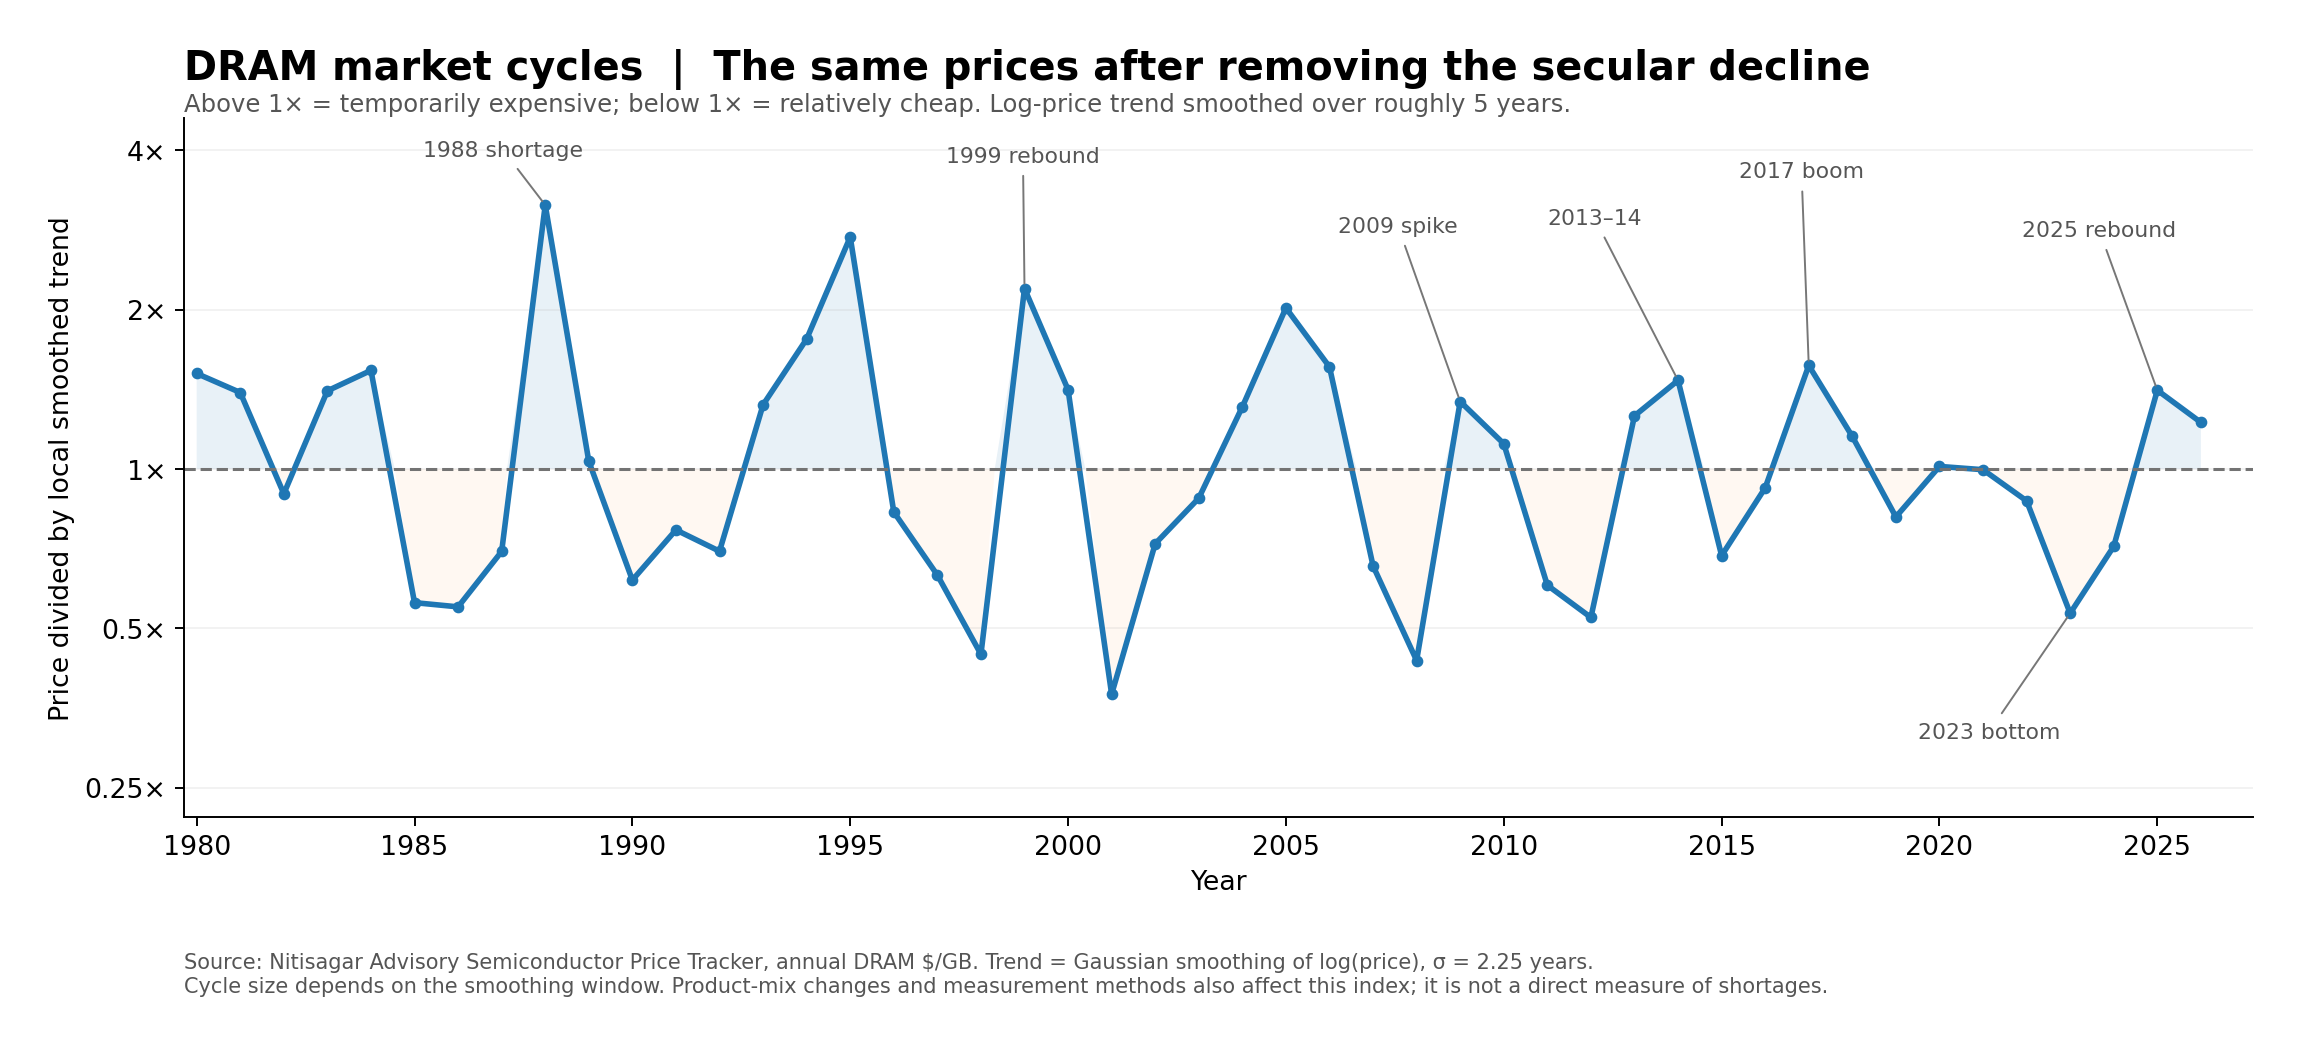
This view divides each year’s price by a smoothed local trend. A reading of 1× is on trend, 2× is twice the trend price and 0.5× is half of it. DRAM reached 3.15× trend in 1988, 2.19× in 1999 and about 2× in 2005. The 2023 low was 0.53× trend, followed by a rebound to 1.41× in 2025.
Demand can rise faster than chipmakers can add capacity. When more production comes online, the balance can swing the other way. Federal Reserve researchers documented this pattern in the mid-1990s, when a large expansion in DRAM production capacity preceded a steep fall in prices. Federal Reserve research on semiconductor prices
The trend uses centered Gaussian smoothing of log prices, with a standard deviation of 2.25 years. Each estimate draws on nearby observations on both sides, so the chart describes the cycle with hindsight.
Semiconductor stocks and Micron versus the S&P 500
For the industry comparison, I used the value-weighted Fama–French Chips portfolio, which covers U.S. electronic-equipment companies, including semiconductor makers. For a closer look at memory manufacturing, I used Micron as a single-company proxy. All returns include dividends and run through the last full calendar year in the study, 2025. Kenneth French Data Library · S&P 500 annual total returns · Micron annual returns
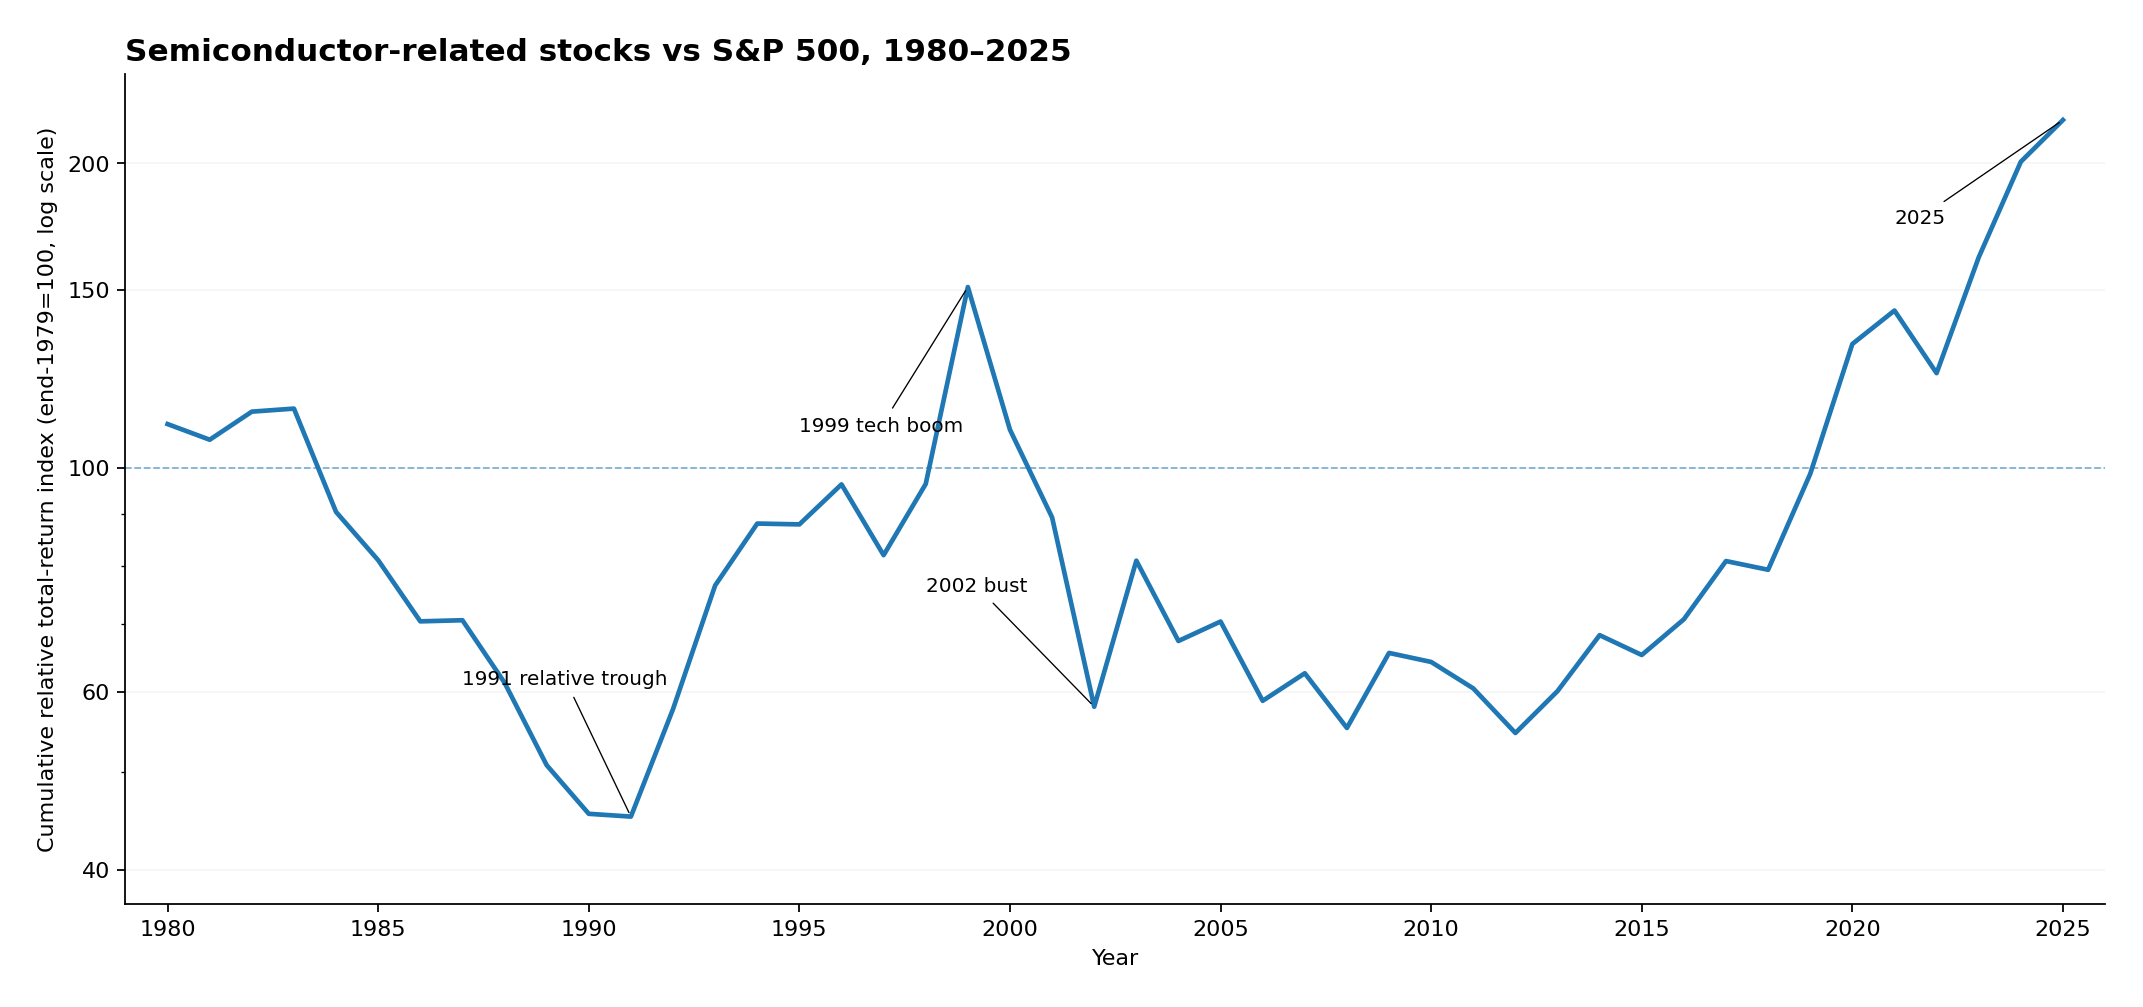
From 1980 through 2025, the Chips portfolio compounded at 14.2% a year, versus 12.2% for the S&P 500. It ended the period with about 2.2 times the benchmark’s cumulative wealth. A rising line means Chips outperformed during that stretch. The portfolio lagged in the 1980s, surged in the 1990s, fell well behind in the 2000s and pulled ahead again from the late 2010s.
| Period | Chips portfolio | S&P 500 | Micron |
|---|---|---|---|
| 1980–1989 | 9.9% | 17.6% | — |
| 1990–1999 | 31.8% | 18.2% | 44.9% |
| 2000–2009 | −8.9% | −1.0% | −12.3% |
| 2010–2019 | 18.3% | 13.6% | 17.7% |
| 2020–2025 | 31.6% | 15.1% | 32.6% |
Annualized total returns. Micron’s first full calendar year in the comparison is 1985.
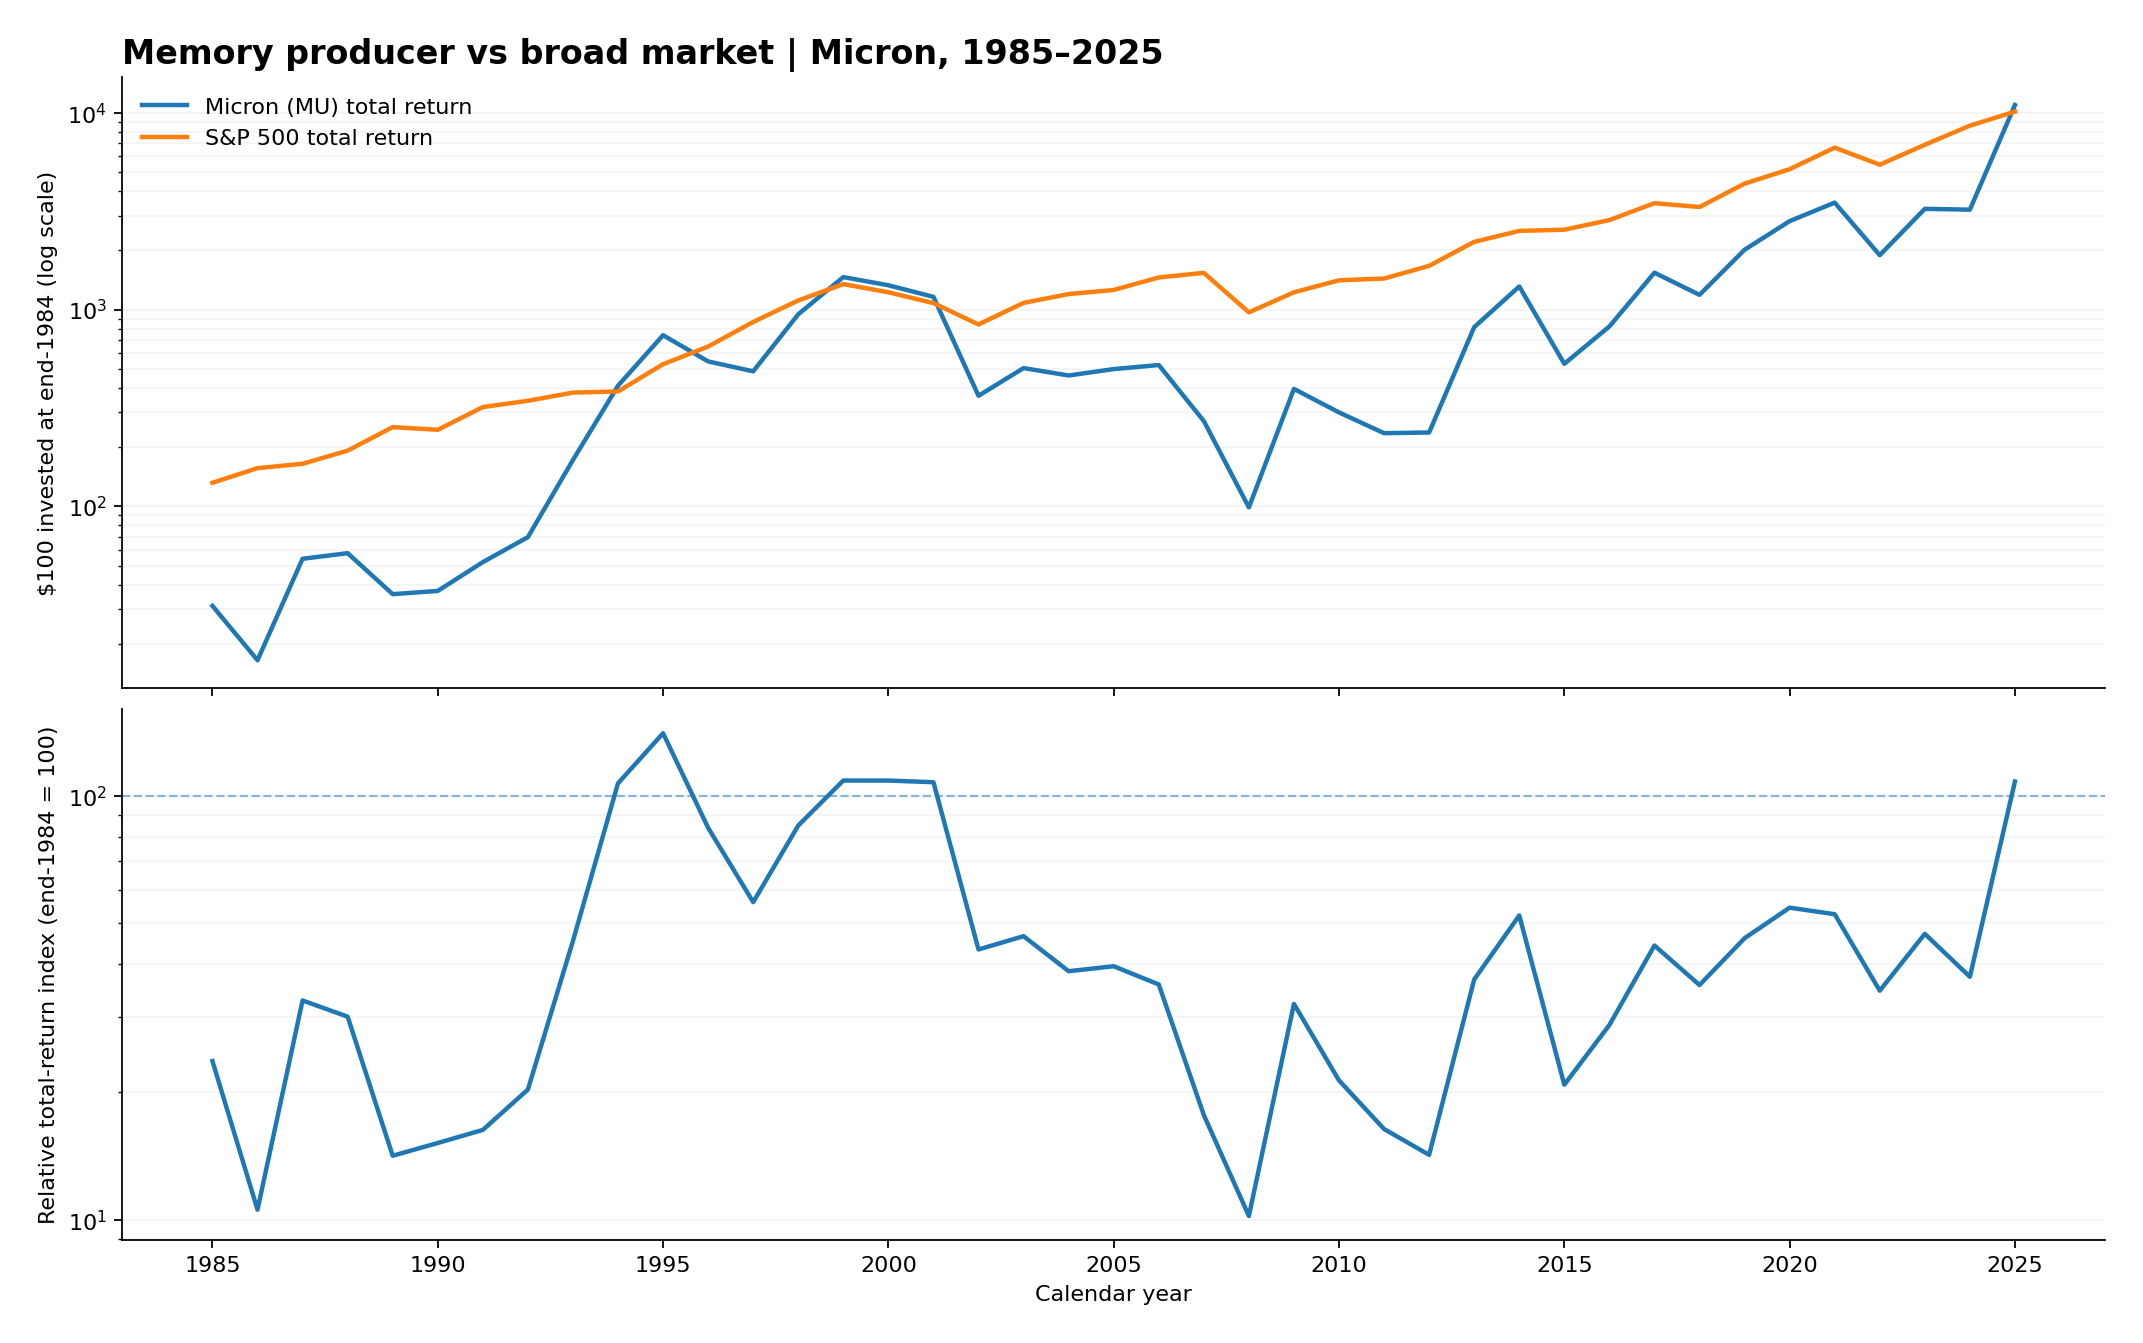
Micron compounded at 12.1% a year from 1985 through 2025, versus 11.9% for the S&P 500 over the same years. Micron ended about 8% ahead in cumulative wealth. That narrow gap came after decades of much larger swings, including years when Micron lost more than half its value.
Putting DRAM prices and stock performance together
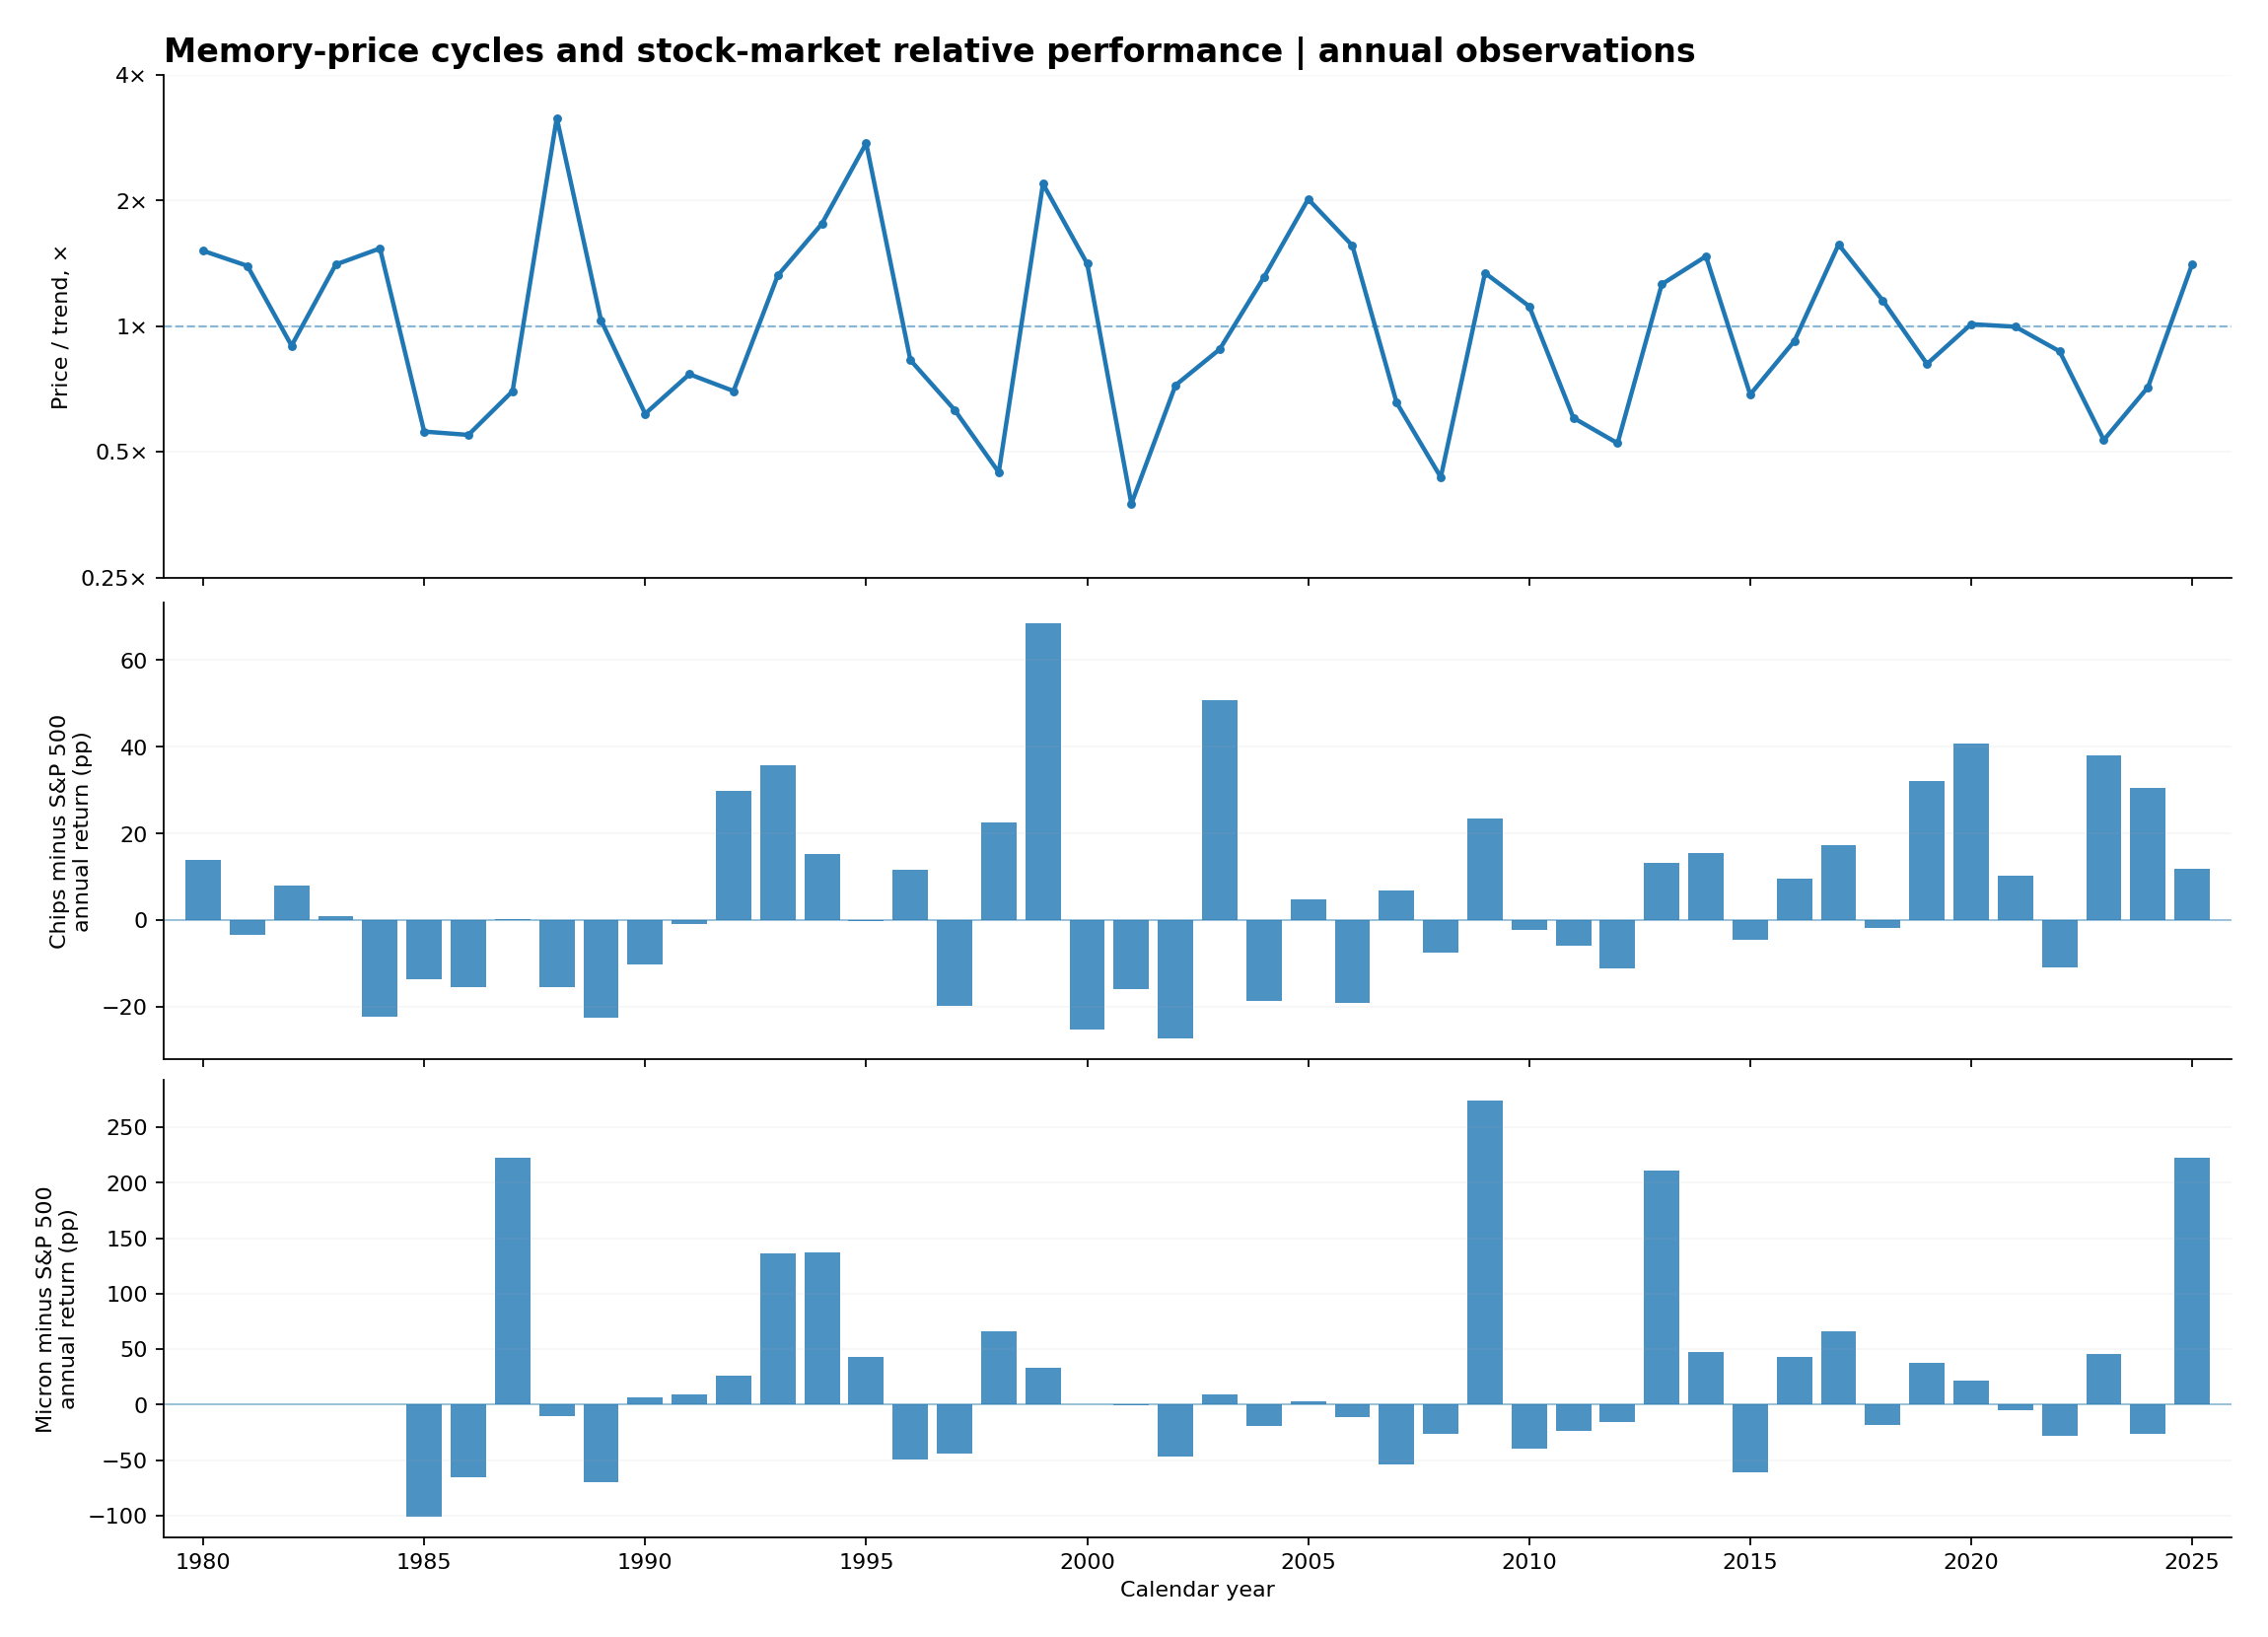
The top panel shows the trend-adjusted DRAM price. The bars below show how many percentage points each stock series gained or lost relative to the S&P 500 that year. In 2013, DRAM rose from $3.70 to $7.90 per gigabyte and Micron returned 243%, roughly 211 percentage points ahead of the index. In 1988, DRAM prices more than tripled while both Micron and the Chips portfolio trailed the S&P 500.
I also checked whether an unusually large price move was associated with outperformance later. For each year, I took the change in log DRAM prices and subtracted the median change over the preceding five years. I then correlated that measure with stock returns relative to the S&P 500.
| Stock series | Same year | Next year | Next two years |
|---|---|---|---|
| Chips portfolio | +0.33 | −0.11 | −0.30 |
| Micron | +0.49 | 0.00 | −0.15 |
Pearson correlations, with 38–40 observations per comparison. The two-year column uses cumulative relative total returns over the two following calendar years.
The clearest relationship was within the same year, especially for Micron. The following year’s correlation was close to zero for both series. The largest forward correlation in magnitude, −0.30 for Chips over two years, had an unadjusted p-value of 0.067. Stock prices may already reflect some expectations about a recovery by the time it shows up in the annual DRAM series. The small sample and the changing mix of memory products limit what we can infer from these results.